InfraMonitor
Contact Us
- Seismoacoustics Software Team
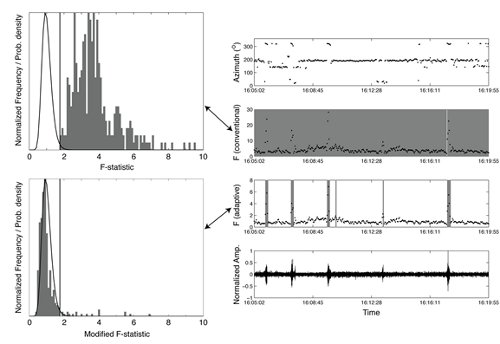
Detection: The AFD method in comparison with a conventional F-detector for infrasound data containing five transient signals from mine shots but contaminated by wind farm noise. The conventional detector identifies the full data segment as a detection (represented by shaded gray areas on the right panel) whereas the AFD only detects the mining explosion signals.
About the tool
InfraMonitor is a Matlab-based tool for infrasound monitoring that incorporates LANL-developed detection, association, and location algorithms in addition to a Matlab implementation of the Tau-P raytracing technique (Garces et al., 1998, Drob et al., 2010).
The Adaptive F Detector
The Adaptive F-detector (AFD) technique is outlined by Arrowsmith et al. (2008, 2009). In contrast with other routinely used infrasound detectors, the AFD utilizes a contextual detection hypothesis that adaptively accounts for temporally variable correlated ambient noise.
This technique reduces the number of false alarms caused by background noise sources such as ocean noise, wind farms, and other continuous wave sources.
Association
The infrasound association (IA) algorithm uses a grid search approach to relate arrivals at multiple arrays (Arrowsmith et al., 2008).
InfraMonitor searches for groups of arrivals with backazimuths and inter-array delay times that are consistent with each grid node. When such groups of arrivals are identified, they are associated and input to the localization procedure described below.
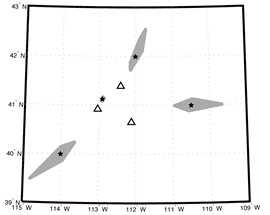
Association: Gray areas represent grid nodes associated with test events (stars) at three arrays.
BISL
The BISL technique (Modrak et al., 2010) uses a statistical approach for infrasound location that can appropriately account for both model and measurement uncertainties inherent to infrasound. Phase identification is replaced by the use of a Bayesian prior on group velocity, with both arrival times and backazimuths contributing to the estimation of a location polygon for a specified confidence level.
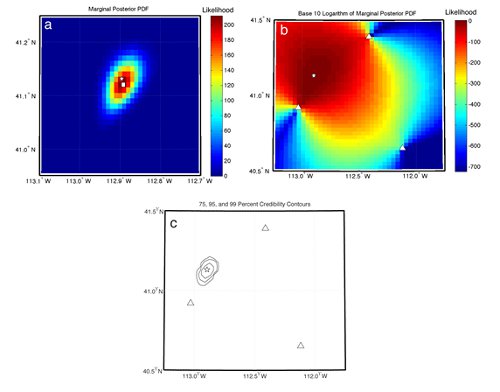
Location: An illustration of the application of BISL to a rocket motor detonation conducted at the Utah Test and Training Range and recorded by three arrays. The location polygons are calculated by taking slices through the posterior PDF (shown as a color plot).
